

For Sage 300 Construction (CRE)
In a previous article, we discussed 5 tips for more effective construction project management (it’s one of the most popular articles on our website!). In some way, all 5 tips rely on your ability to easily access data, benchmark performance, and continually monitor key metrics in order to improve decision-making.
That’s why we want to introduce you to a relatively new and very important tool in Sage 300 Construction called the Sage Executive Dashboard.
What is Sage Executive Dashboard?
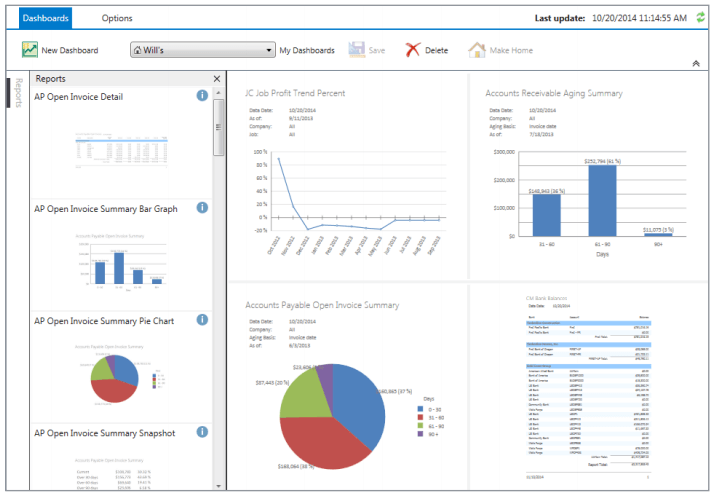
Sage Executive Dashboard for Sage 300 CRE is a visual reporting tool that helps you stay on top of key metrics and closely monitor the financial health of your construction business. It converts all of the data in your Sage 300 Construction software into charts, graphs, and other visual queues that help you quickly assess the numbers at a glance.
You can monitor trends such as project profitability, property occupancy, and cash flow to identify potential issues and, if necessary, take steps to avoid them. If you spot a chart or graph that doesn’t look quite right, you can drill down to the underlying details in your Sage 300 CRE system.
There are several pre-built dashboard views and reports that are delivered right “out of the box”, or you can create and customize your own dashboards using the tools provided.
Visualize Success
Like driving a car, one glance at the dashboard tells you everything you need to know about your speed, fuel, oil temperature, and other vital systems to ensure your car runs smoothly.
The same thing can be said about the Sage Executive Dashboard that provides visual representation of important company metrics and project activity. The charting tools and dashboards are able to convert huge volumes of raw data scattered across your system into visual queues that are far easier to interpret at a glance.
In short, you’re monitoring the vital signs of your business – sometimes referred to as key performance indicators or KPIs – that your management team can rely on to evaluate progress toward long-term business goals.
What About Your “Traditional” Reports?
Dashboards simply offer features that can be used to complement your existing “traditional” reports which still play an important role in your business. Because dashboard reporting tends to be more user-friendly than traditional reporting tools, you can easily slice and dice data ‘on the fly’ without having to call IT to customize your reports.
Plus the visual dashboards and graphical charts provide meaningful insight at a glance – an objective that would be much more difficult if you were to “glance” at a 15-page report.
Video: Getting Started with Sage Executive Dashboard
Gain Deeper Insight Into Your Construction Business
 Download this valuable eBook and discover the many ways that Sage 300 Construction and Real Estate software can help you gain deeper insight into your business with executive dashboards, project reports, and detailed construction analytics.
Need Help Getting Started?
Get in touch with the team at Accordant Company and one of our friendly consultants will follow up to answer questions or help you get started with Sage Executive Dashboard.


